
The Performance Marketing Scorecard: CTR, CPC, CPA & ROAS
A simple performance marketing case study explaining CTR, CPC, CPA and ROAS, and how businesses can use these metrics to measure advertising efficiency, conversions, and revenue.
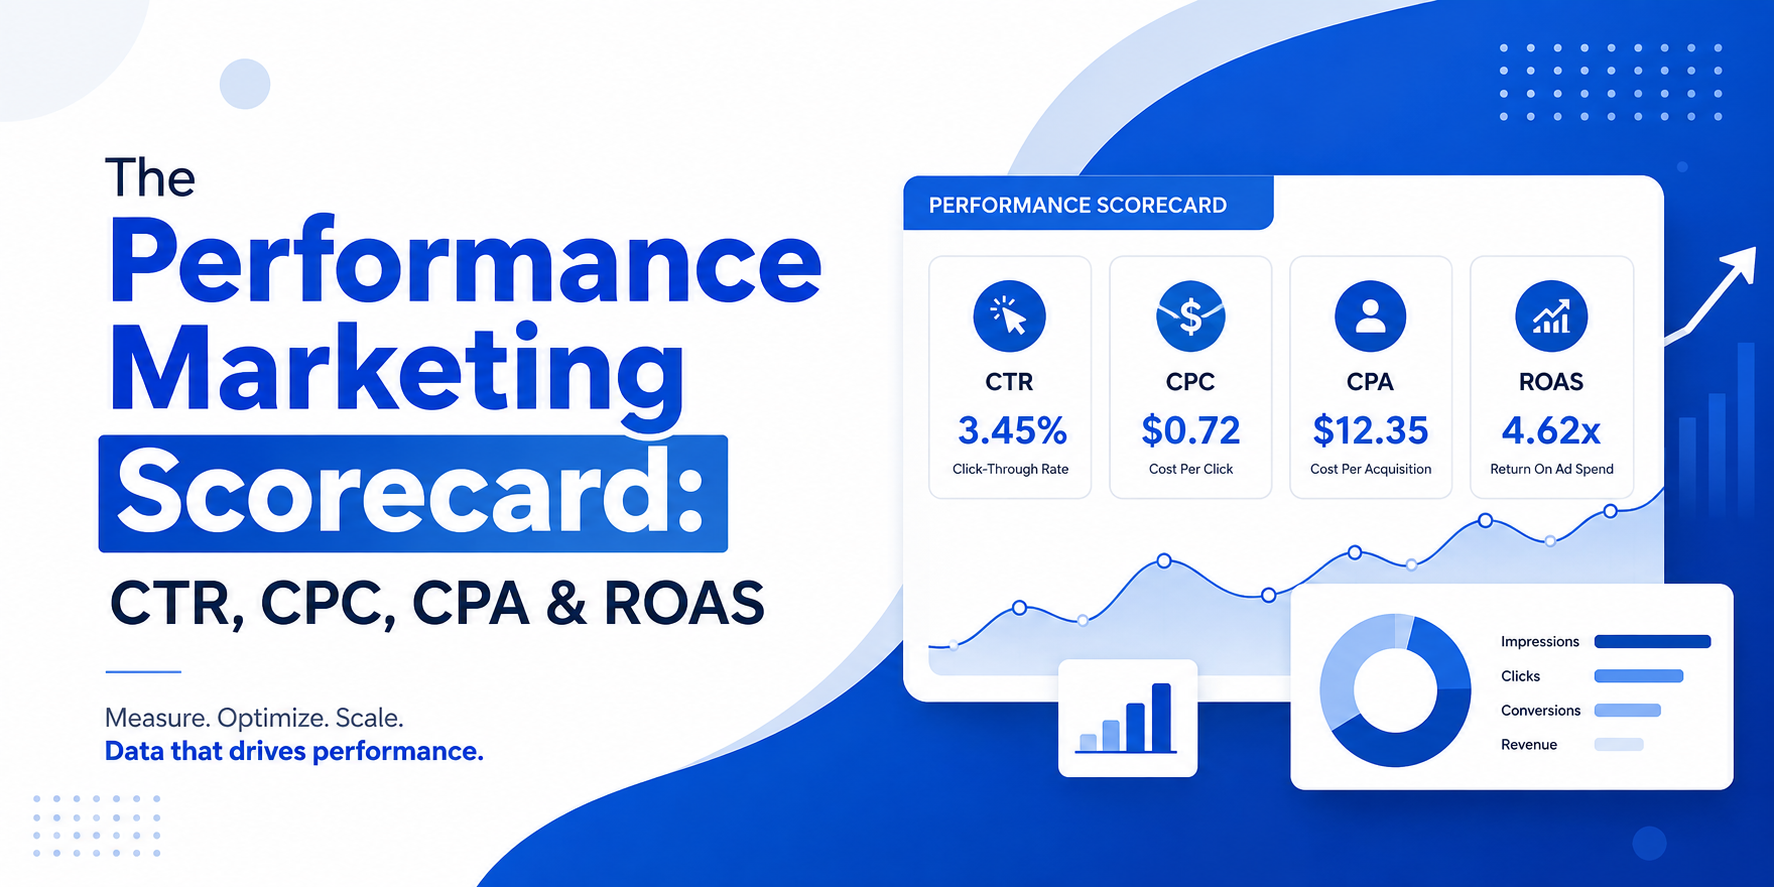
Industry
Technology & Social Media
Service
Performance Marketing
Challenge
The Performance Marketing Scorecard: CTR, CPC, CPA & ROAS
Clicks Are Easy to Count. Knowing What They’re Worth Is the Real Skill
Running digital ads is not just about getting clicks. The real question is whether those clicks generate leads, customers, and revenue.
This case study breaks down four essential performance marketing metrics- CTR, CPC, CPA, and ROAS- through a simple campaign example.
An e-commerce business invested ₹1,00,000 in a digital advertising campaign.
The campaign generated plenty of visibility and traffic, but the business needed to understand:
Are people interested in the ads?
Is the cost per click sustainable?
How much does each conversion actually cost?
Is the advertising generating enough revenue?
Where can the campaign be optimised?
Without connecting these metrics, simply looking at clicks or impressions could give a misleading picture of campaign performance.
Solution
The campaign was evaluated using four core digital marketing metrics:
1. CTR — Click-Through Rate
CTR = Clicks ÷ Impressions × 100
The campaign generated:
100,000 impressions + 2,500 clicks = 2.5% CTR
This showed how effectively the advertisement attracted attention and encouraged users to click.
2. CPC — Cost Per Click
CPC = Ad Spend ÷ Clicks
₹1,00,000 ÷ 2,500 = ₹40 CPC
The business spent an average of ₹40 for every click.
3. CPA — Cost Per Acquisition
CPA = Ad Spend ÷ Conversions
With 100 conversions:
₹1,00,000 ÷ 100 = ₹1,000 CPA
The campaign therefore cost an average of ₹1,000 per conversion.
4. ROAS — Return on Ad Spend
ROAS = Revenue ÷ Ad Spend
With ₹3,00,000 revenue from ₹1,00,000 advertising spend:
₹3,00,000 ÷ ₹1,00,000 = 3X ROAS
The campaign generated ₹3 in revenue for every ₹1 spent on advertising.
Process
The campaign was analysed as a complete performance funnel:
Attention → Click → Conversion → Revenue
Step 1 — Measure CTR
Determine whether the creative and messaging are generating interest.
Step 2 — Analyse CPC
Understand how efficiently the campaign is generating traffic.
Step 3 — Track CPA
Measure how much the business is spending to acquire each conversion.
Step 4 — Evaluate ROAS
Connect advertising spend with revenue generation.
Step 5 — Optimise the weakest stage
Improve creative, targeting, landing pages, offers, or campaign allocation based on where performance drops.
This approach prevents marketers from optimising one metric while ignoring the bigger business picture.
Results
The illustrative campaign produced:
Metric | Result |
|---|---|
Impressions | 100,000 |
Clicks | 2,500 |
CTR | 2.5% |
Ad Spend | ₹1,00,000 |
CPC | ₹40 |
Conversions | 100 |
CPA | ₹1,000 |
Revenue | ₹3,00,000 |
ROAS | 3X |
The numbers reveal the complete campaign story.
CTR showed whether the advertisement attracted attention.
CPC showed the cost of generating traffic.
CPA showed the cost of acquiring a conversion.
ROAS showed the revenue generated from the advertising investment.